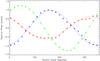
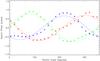
Fig. 14

Spectral (top) and spatial (bottom) flexure measured from the location of an arcline (vertical shifts) and slitlet edges (horizontal shifts) respectively on raw detector frames, as a function of rotator angle. The 3 colours represent the 3 instrument segments (red/green/blue for segments 1/2/3). The lines trace sinusoidal fits to the data: while this is a good match for the spectral flexure, it is only an approximation to spatial flexure. Importantly, in both cases, the scale of the shift is ~±1 pixel, indicating that which pixels on the detector are illuminated depends on rotator angle.
Current usage metrics show cumulative count of Article Views (full-text article views including HTML views, PDF and ePub downloads, according to the available data) and Abstracts Views on Vision4Press platform.
Data correspond to usage on the plateform after 2015. The current usage metrics is available 48-96 hours after online publication and is updated daily on week days.
Initial download of the metrics may take a while.