Free Access
Fig. 2
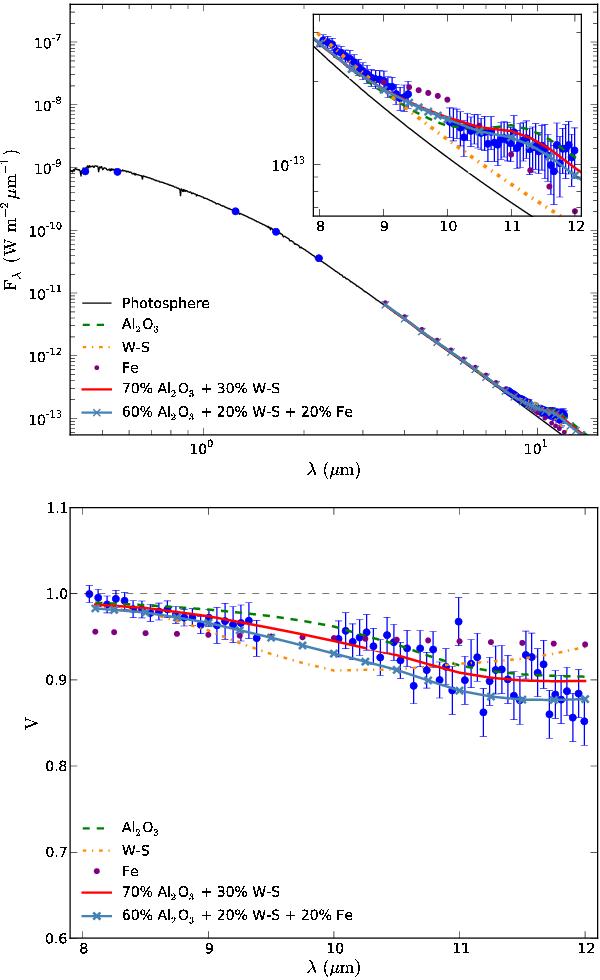
Calibrated visibility and spectrum of X Sgr (blue dots with error bars). The solid black line in the upper panel represents the photosphere of the Cepheid modeled with Kurucz’s spectra, while the dashed black line in the lower panel stands for an unresolved star for comparison. Other color curves are the fitted models.
Current usage metrics show cumulative count of Article Views (full-text article views including HTML views, PDF and ePub downloads, according to the available data) and Abstracts Views on Vision4Press platform.
Data correspond to usage on the plateform after 2015. The current usage metrics is available 48-96 hours after online publication and is updated daily on week days.
Initial download of the metrics may take a while.