Fig. 8
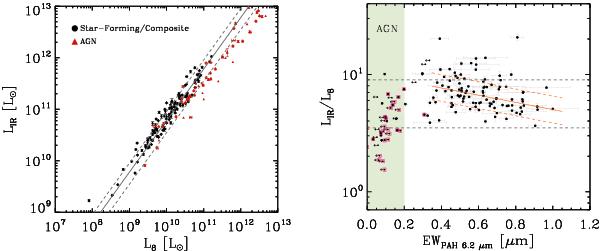
Left: LIR versus L8 for the whole 5MUSES sample. Black circles correspond to purely star-forming and composite sources, while red triangles correspond to AGN. The solid grey line depicts the median and 68% dispersion of composite and star-forming galaxies. Right: LIR/L8 versus EW of 6.2 μm. The horizontal lines enclose the values of LIR/L8 within the 68% dispersion from the median. The orange lines depict the best-fit linear regression and its scatter in the EW6.2 ≥ 0.4 μm regime. Purple squares correspond to sources with fAGN > 0.5.
Current usage metrics show cumulative count of Article Views (full-text article views including HTML views, PDF and ePub downloads, according to the available data) and Abstracts Views on Vision4Press platform.
Data correspond to usage on the plateform after 2015. The current usage metrics is available 48-96 hours after online publication and is updated daily on week days.
Initial download of the metrics may take a while.