Fig. 6
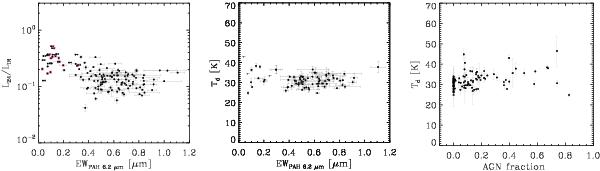
Left: L24/LIR ratio as a function of the 6.2 μm PAH feature EW. Purple squares correspond to sources for which the SED decomposition suggests that the AGN contribution to the total LIR is >50%. Leftward arrows denote upper limits in EW6.2 measurements. Middle: Td versus EW6.2. Td estimates are derived based on a modified blackbody model for 79 sources (out of the total 154 sources shown in the left panel), which are detected in at least three bands at λrest> 60 μm. Right: Td versus fraction of LIR arising from AGN activity, as derived based on SED decomposition.
Current usage metrics show cumulative count of Article Views (full-text article views including HTML views, PDF and ePub downloads, according to the available data) and Abstracts Views on Vision4Press platform.
Data correspond to usage on the plateform after 2015. The current usage metrics is available 48-96 hours after online publication and is updated daily on week days.
Initial download of the metrics may take a while.