Fig. 10
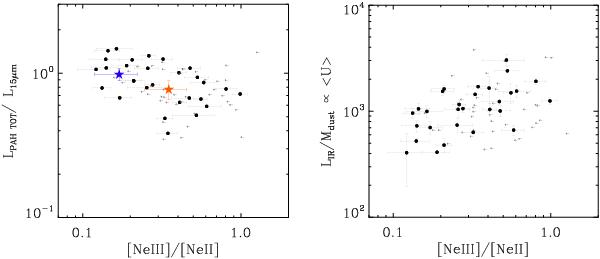
Left:  /L15 versus [Ne iii]/[Ne ii], as measured from the IRS spectra of the sources in our sample with EW6.2 ≥ 0.4 μm. The orange and blue stars correspond to the average spectra of galaxies with IR8 ≤ 6.0 and 6.0 < IR8 < 9.0, respectively. Leftward arrows denote upper limits of the [Ne iii]/[Ne ii] ratio for sources with only a [Ne ii] detection Right: dust-mass-weighted luminosity (LIR/Mdust) as a function of the hardness of the radiation field traced by the [Ne iii]/[Ne ii] line ratio.
Current usage metrics show cumulative count of Article Views (full-text article views including HTML views, PDF and ePub downloads, according to the available data) and Abstracts Views on Vision4Press platform.
Data correspond to usage on the plateform after 2015. The current usage metrics is available 48-96 hours after online publication and is updated daily on week days.
Initial download of the metrics may take a while.