Free Access
Fig. 4
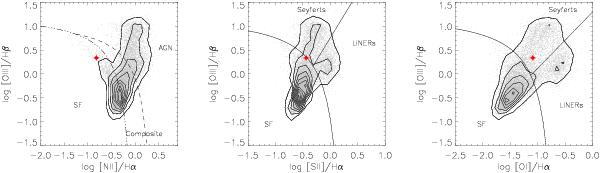
Diagnostic diagrams [N ii]/Hα vs. [O iii]/Hβ, [S ii]/Hα vs. [O iii]/Hβ and [O i]/Hα vs. [O iii]/Hβ for the radio emitters taken from Vitale et al. (2012). The contours show galaxy densities in steps of 80 galaxies per each additional contour. The position of the source analyzed here is shown as a red dot.
Current usage metrics show cumulative count of Article Views (full-text article views including HTML views, PDF and ePub downloads, according to the available data) and Abstracts Views on Vision4Press platform.
Data correspond to usage on the plateform after 2015. The current usage metrics is available 48-96 hours after online publication and is updated daily on week days.
Initial download of the metrics may take a while.