Free Access
Fig. 3
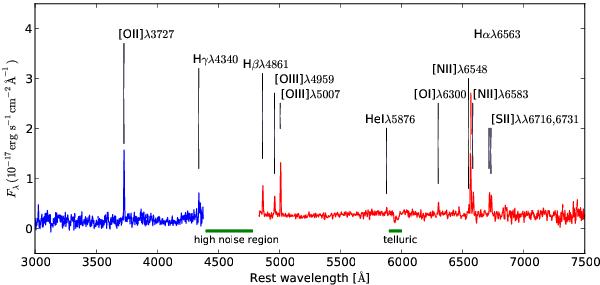
Optical spectrum of J0808. The blue and red spectra represent the data from the respective channel. A gap between the two channels that has been excluded because of high noise and a region that shows telluric features are marked.
Current usage metrics show cumulative count of Article Views (full-text article views including HTML views, PDF and ePub downloads, according to the available data) and Abstracts Views on Vision4Press platform.
Data correspond to usage on the plateform after 2015. The current usage metrics is available 48-96 hours after online publication and is updated daily on week days.
Initial download of the metrics may take a while.