Fig. 2
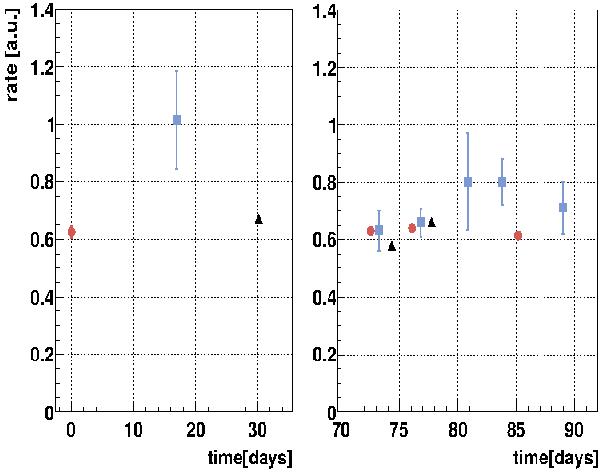
UVOT lightcurve. The UVM2 rates (squares) were multiplied by 10, the UVW2 rates (circles) by 0.198, and UVW1 ones (triangles) by a factor 0.056. These two last factors are calculated by equalizing UVM2 and UVW2(UVW1) rates during observations 5 and 9, when two filters were used. For UVW1 and 2, error bars are often smaller than the data-point marker.
Current usage metrics show cumulative count of Article Views (full-text article views including HTML views, PDF and ePub downloads, according to the available data) and Abstracts Views on Vision4Press platform.
Data correspond to usage on the plateform after 2015. The current usage metrics is available 48-96 hours after online publication and is updated daily on week days.
Initial download of the metrics may take a while.