Fig. 8
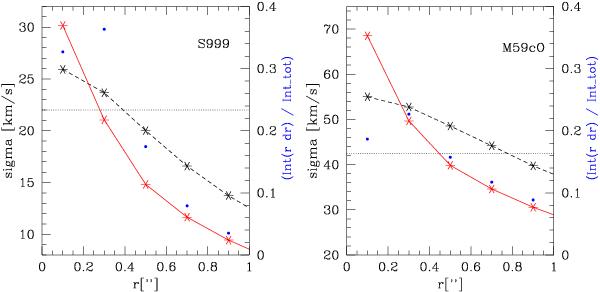
Expected velocity dispersion profile for the two UCDs with the highest predicted BH masses. Left panel: Virgo UCD S999 (Haşegan et al. 2005), for which a central BH of ~ 2.5 × 10⁷ M⊙ is predicted. Right panel: virgo UCD M59cO (Chilingarian & Mamon 2008), for which a central BH of ~ 5 × 10⁷ M⊙ is predicted. In both plots, the assumed spatial resolution is 0.2′′, corresponding to the typical resolution possible in ground based AO assisted spectroscopy. The measured global velocity dispersion is indicated by the horizontal dotted line. The dashed (black) line is the velocity dispersion profile that reproduces the observed global velocity dispersion for the assumption of a uniformally distributed dark mass component on top of the photometric mass. The solid (red) line is the velocity dispersion profile that reproduces the observed global velocity dispersion for the assumption of a central point mass on top of the photometric mass. The small (blue) dots indicate the fraction of light from the source that is contained within each ring around the indicated values of r, with the right y-axis showing the scale.
Current usage metrics show cumulative count of Article Views (full-text article views including HTML views, PDF and ePub downloads, according to the available data) and Abstracts Views on Vision4Press platform.
Data correspond to usage on the plateform after 2015. The current usage metrics is available 48-96 hours after online publication and is updated daily on week days.
Initial download of the metrics may take a while.