Fig. 7
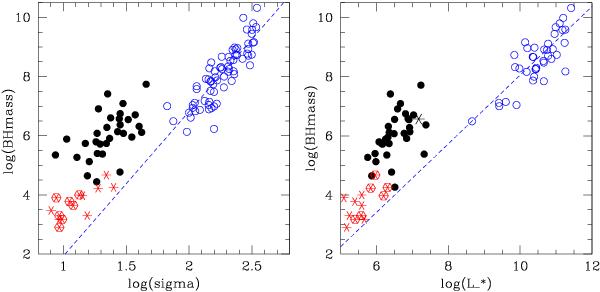
Left panel: MBH-σ relation for UCDs (black filled circles), compared to Galactic GCs (red asterisks, Lützgendorf et al. 2013; sources with hexagons have only upper limits to their BH mass) and galaxies (blue circles; McConnell et al. 2013). The blue dashed line is a linear fit in log-log space to the galaxy sample. It has a slope of 4.9. The BH mass of UCDs is on average offset by about 2 dex from this relation. Right panel: MBH-luminosity relation for the same sources as in the left panel. Some objects from the galaxy sample of McConnell et al. are not included here since they lack information on host galaxy luminosity. The blue dashed line is a linear fit in log-log space to the galaxy sample with a slope of 1.16, indicating near direct proportionality between BH mass and host luminosity. The luminosity of UCDs is on average offset by 2 dex with respect to this reference. For illustration purposes we also show as large asterisk the central black hole mass of the Milky Way vs. the luminosity of the Milky Way’s nuclear cluster (Graham & Spitler 2009).
Current usage metrics show cumulative count of Article Views (full-text article views including HTML views, PDF and ePub downloads, according to the available data) and Abstracts Views on Vision4Press platform.
Data correspond to usage on the plateform after 2015. The current usage metrics is available 48-96 hours after online publication and is updated daily on week days.
Initial download of the metrics may take a while.