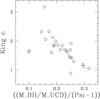
Fig. 6
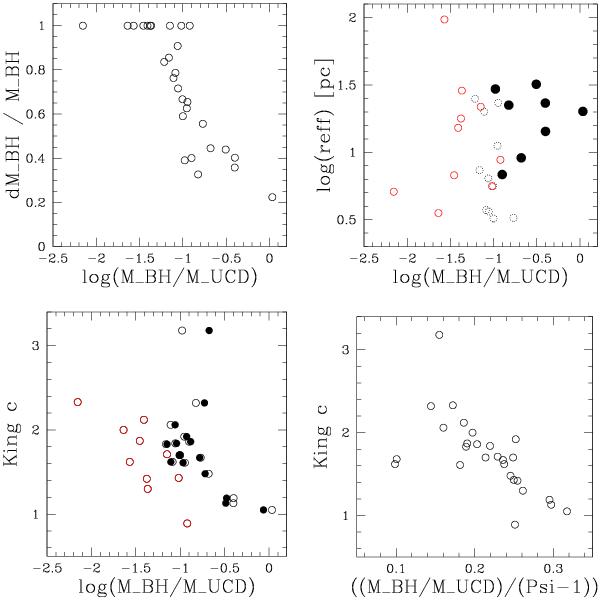
Top left panel: BH mass fraction of UCDs plotted vs. its relative error. Sources with relative error of one are those where the lower error bar of the BH mass is consistent with 0. BH mass estimates more significant than ~2σ require ≳10% BH mass. Top right panel: BH mass fraction plotted vs. the effective radius in arcseconds. Red open circles are those objects where the lower error bounds of the dynamical mass measurements are consistent with zero BH mass. Dotted black circles denote those UCDs whose BH mass estimate is different from zero between 1 and 2σ significance. Filled black circles indicate those UCDs with black hole masses more than 2σ significant. These are those with relative error <0.5 in the top left panel. Bottom left panel: BH mass fraction in UCDs is plotted vs. the concentration parameter c of their surface brightness distribution, when parametrised as a King profile. The filled dots indicate the BH mass fraction assuming that all UCDs have the same King parameter c of 1.75, taking the correlation between c and BH mass into account as shown in the right panel. Bottom right panel: the y-axis shows the concentration parameter c as in the left panel. The x-axis shows the ratio between the BH mass fraction and the additional dynamical mass derived under the assumption that mass follows light, (Ψ − 1). The fact that this ratio is generally below 1 is because the putative BH is located in the centre of the UCD, as opposed to a uniformally distributed additional mass component. The overall trend is due to the fact that for more centrally concentrated objects, the effect of the BH on the integrated velocity dispersion increases. On average, a central BH of a given mass has the same effect on the global velocity dispersion as 4–5 times that mass distributed uniformally.
Current usage metrics show cumulative count of Article Views (full-text article views including HTML views, PDF and ePub downloads, according to the available data) and Abstracts Views on Vision4Press platform.
Data correspond to usage on the plateform after 2015. The current usage metrics is available 48-96 hours after online publication and is updated daily on week days.
Initial download of the metrics may take a while.