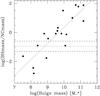
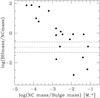
Fig. 5
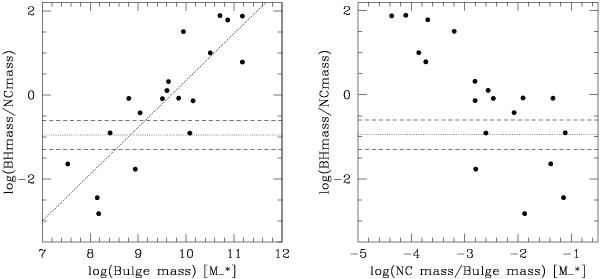
Left panel: for those galaxies with a BH and a NC in the sample of Graham et al. (2009), we plot the ratio between BH and NC mass vs. the total bulge mass of the host galaxy. A least square linear fit through the data points is indicated as dotted line. The horizontal dotted and dashed lines indicate the median and rms scatter of BH mass fraction in UCDs, see Fig. 6. The typical host galaxy bulge masses for those nuclei that have a BH mass fraction comparable to UCDs is 109± 1 solar masses. Right panel: analogous to the left plot, we give on the x-axis the ratio of NC over host galaxy bulge mass. The typical NC/bulge mass fraction is ~1% in the range of BH/NC mass fraction of UCDs. We do not plot a linear fit to the literature data due to their larger scatter compared to the left panel.
Current usage metrics show cumulative count of Article Views (full-text article views including HTML views, PDF and ePub downloads, according to the available data) and Abstracts Views on Vision4Press platform.
Data correspond to usage on the plateform after 2015. The current usage metrics is available 48-96 hours after online publication and is updated daily on week days.
Initial download of the metrics may take a while.