Fig. 4
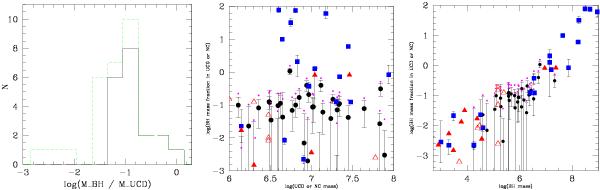
Left panel: histogram of the black hole mass fraction as estimated for those UCDs with Ψ = (M/L)dyn/(M/L)pop > 1, see Sect. 3. The solid histogram corresponds to BH mass estimates whose lower 1σ error bound is above 0. The dashed (green) histogram includes also those UCDs for which the lower 1σ error bound is consistent with 0. Middle panel: black hole mass fraction in compact stellar systems plotted vs. the stellar mass of the compact stellar systems. Filled black circles are the UCDs from the left panel. The UCD mass used on the x-axis is the stellar population mass Mpop for an age of 13 Gyr. The small filled (magenta) circles indicate the modelled BH mass assuming a stellar population age of 9 Gyr. Filled blue squares are BH mass measurements in nuclear clusters from Graham et al. (2009) which have a lower BH mass limit larger than 0. Filled (red) triangles are those sources from Graham et al. for which the BH mass is an upper limit. Open (red) triangles are upper limits for BHs in lower mass nuclear clusters from Neumayer & Walcher (2012). Right panel: black hole mass fraction in compact stellar systems plotted vs. the black hole mass, for the same objects as in the middle panel.
Current usage metrics show cumulative count of Article Views (full-text article views including HTML views, PDF and ePub downloads, according to the available data) and Abstracts Views on Vision4Press platform.
Data correspond to usage on the plateform after 2015. The current usage metrics is available 48-96 hours after online publication and is updated daily on week days.
Initial download of the metrics may take a while.