Fig. 3
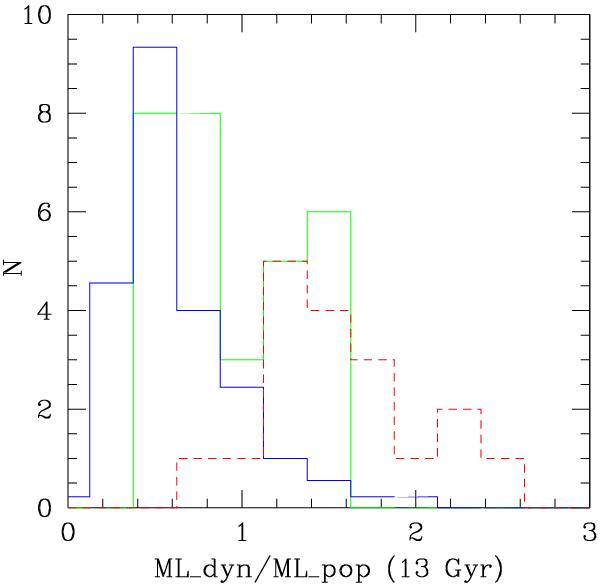
Histogram of Ψ = (M/L)dyn/(M/L)pop for the samples of Fig. 2. The (dashed) red histogram denotes high-mass UCDs with M > 107 M⊙. The green (solid) histogram denotes low-mass UCDs 2 × 10⁶ M⊙ < M < 107 M⊙. The blue (solid) hostogram denotes globular clusters (M < 2 × 10⁶ M⊙). The histogram for GCs is scaled down by a factor of 9 to fit the plot. The low Ψ peak of the green histogram is close to the peak of the blue (GC) sample. The shift of ~20% between those two peaks is expected from dynamical evolution (e.g. Baumgardt & Makino 2003; Kruijssen & Mieske 2009).
Current usage metrics show cumulative count of Article Views (full-text article views including HTML views, PDF and ePub downloads, according to the available data) and Abstracts Views on Vision4Press platform.
Data correspond to usage on the plateform after 2015. The current usage metrics is available 48-96 hours after online publication and is updated daily on week days.
Initial download of the metrics may take a while.