Fig. 2
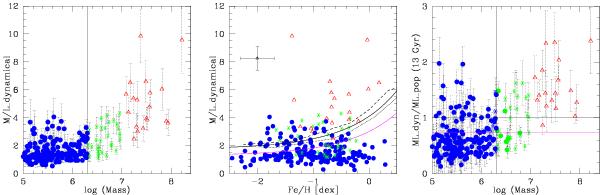
Left panel: dynamical mass-to-light ratios of compact stellar systems plotted vs. their dynamical mass. Data taken from the literature as indicated in the text. Sources are colour coded according to mass. GCs (M < 2 × 10⁶ M⊙) are blue, low-mass UCDs (2 × 10⁶ M⊙ < M < 107 M⊙) are green, high-mass UCDs (M > 107 M⊙) are red. GC data points are dominated by Local Group measurements, whereas UCD data points are mainly extragalactic (Fornax/Virgo/CenA). Middle panel: dynamical mass-to-light ratios of compact stellar systems plotted vs. their metallicities. Sample and symbols as in the left panel. The dotted lines correspond to predicted stellar M/L ratios for a 13 Gyr stellar population of solar α abundance; top line is from Maraston et al. (2005), bottom line is from Bruzual & Charlot (2003). The solid curve in between is an exponential fit to the mean of the two dotted lines. It represents the maximum stellar M/L for a canonical IMF (Kroupa/Chabrier). Sources with dynamical M/L ratios above that solid line need some extra dark mass, and/or IMF variation. The (magenta) thin solid line below the thick solid line corresponds to the stellar M/L ratio for a younger, 9 Gyr stellar population of solar α abundance. Right panel: dimensionless quantity Ψ = (M/L)dyn/(M/L)pop is plotted vs. dynamical mass for the same sources as in previous plots, using Eq. (4) for (M/L)pop, see also middle panel. The black horizontal line indicates Ψ = 1 for 13 Gyr assumed age (see also black solid line in middle panel), the (magenta) thin solid line indicates Ψ = 1 for 9 Gyr assumed age (magenta solid line in middle panel). We mark UCDs (M > 2 × 10⁶ M⊙) from the Local Group with (green) filled circles, and massive extragalactic GCs (M < 2 × 10⁶ M⊙) with (blue) asterisks.
Current usage metrics show cumulative count of Article Views (full-text article views including HTML views, PDF and ePub downloads, according to the available data) and Abstracts Views on Vision4Press platform.
Data correspond to usage on the plateform after 2015. The current usage metrics is available 48-96 hours after online publication and is updated daily on week days.
Initial download of the metrics may take a while.