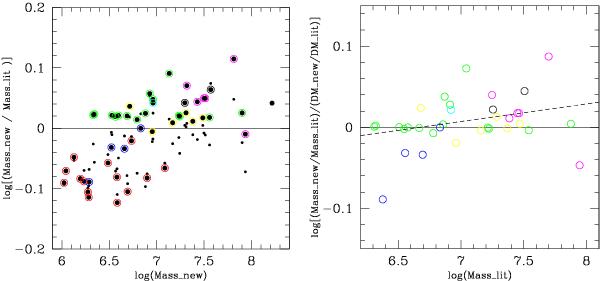
Fig. 1

Left panel: ratio between remodelled and previous literature estimates of dynamical masses of UCDs is plotted vs. their remodelled mass. The original literature source is indicated by the colour coding of the circles around the data points. See Sect. 2.3 for details on the colour coding. For all the data points, we have recalculated the dynamical mass in this paper. Small dots (without a circle) indicate the ratio between the remodelled and literature dynamical mass-to-light ratio M/Ldyn. Right panel: ratio between remodelled and literature mass, cleaned of the effect of update in distance modulus, and without the CenA sample of Taylor et al. (2010), is plotted vs. the literature mass estimate.
Current usage metrics show cumulative count of Article Views (full-text article views including HTML views, PDF and ePub downloads, according to the available data) and Abstracts Views on Vision4Press platform.
Data correspond to usage on the plateform after 2015. The current usage metrics is available 48-96 hours after online publication and is updated daily on week days.
Initial download of the metrics may take a while.


