Fig. 2
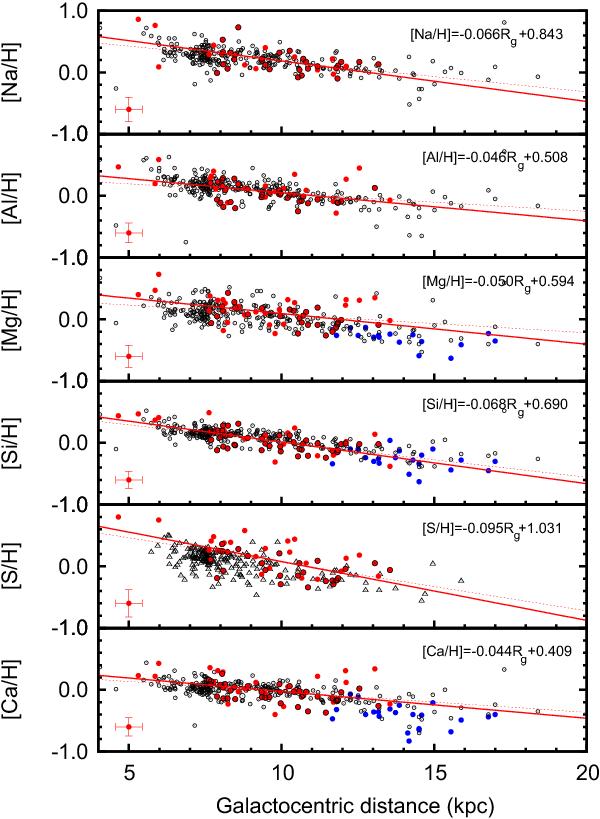
Galactic abundance gradients from Cepheids for light and α elements. The full red dots are our data. We also show data from Luck & Lambert (2011) (black open circles) and if not available, from Luck et al. (2011) (black open triangles). When stars are in common and the abundances fall within 0.2 dex, we overplotted black open circles (triangles) to the red dots. Yong et al. (2006) also provided data for several elements in the outer disk (full blue dots). All the distances are derived with a PWNIR relation. A representative error bar is shown, including both the uncertainty on the atmospheric parameters and the rms uncertainty on the mean abundance [X/H]. We also indicate a linear fit to our data on the [4−15] kpc range (thick red line) and (for some elements) on the [7−15] kpc range (dashed red line).
Current usage metrics show cumulative count of Article Views (full-text article views including HTML views, PDF and ePub downloads, according to the available data) and Abstracts Views on Vision4Press platform.
Data correspond to usage on the plateform after 2015. The current usage metrics is available 48-96 hours after online publication and is updated daily on week days.
Initial download of the metrics may take a while.