Fig. 1
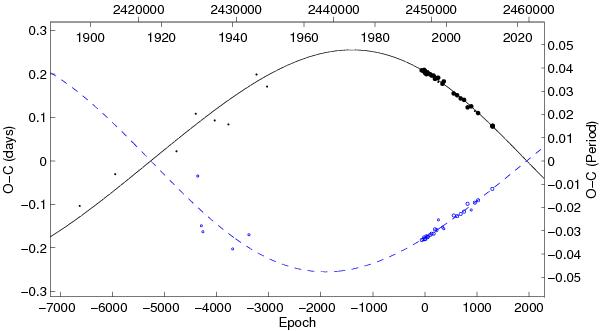
O–C diagram for the times of minima of HV 982. The continuous and dashed curves represent predictions for the primary and secondary eclipses, respectively. The individual primary and secondary minima are denoted by dots and open circles, respectively. Larger symbols correspond to the photoelectric or CCD measurements that were given higher weights in the calculations.
Current usage metrics show cumulative count of Article Views (full-text article views including HTML views, PDF and ePub downloads, according to the available data) and Abstracts Views on Vision4Press platform.
Data correspond to usage on the plateform after 2015. The current usage metrics is available 48-96 hours after online publication and is updated daily on week days.
Initial download of the metrics may take a while.