Free Access
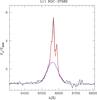
Fig. 6
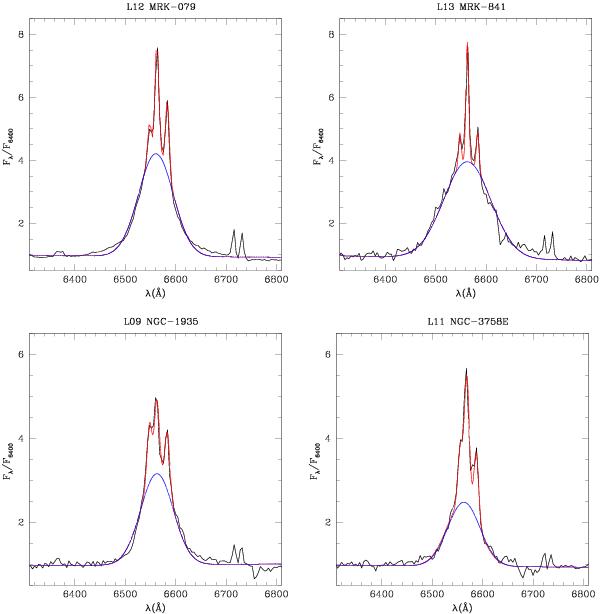
Spectra of the four Seyfert 1 galaxies in the sample. The black lines refer to the original spectra. The red lines show the full fit (continuum + broad + narrow lines), while the blue lines highlight the contribution of the broad Hα component.
This figure is made of several images, please see below:
Current usage metrics show cumulative count of Article Views (full-text article views including HTML views, PDF and ePub downloads, according to the available data) and Abstracts Views on Vision4Press platform.
Data correspond to usage on the plateform after 2015. The current usage metrics is available 48-96 hours after online publication and is updated daily on week days.
Initial download of the metrics may take a while.