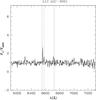
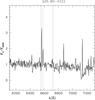
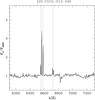
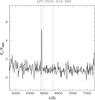
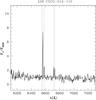
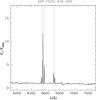
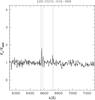
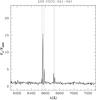
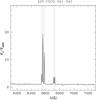
Fig. 4
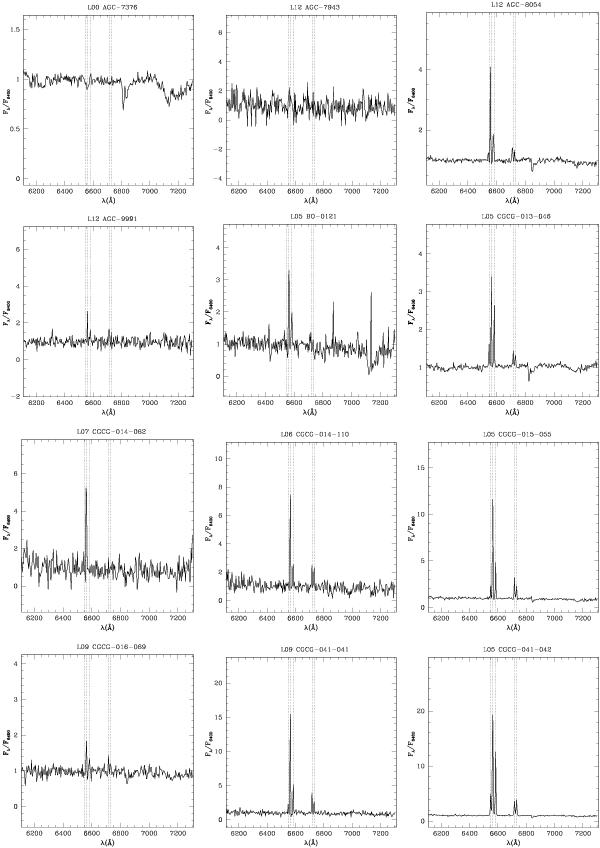
Red restframe-spectra (from 6100 Å to 7300 Å) obtained with the red-channel grism in this work, normalized to the continuum near 6400 Å. The vertical dashed lines give the position of [NII] 6548, Hα (λ6562.8), [NII] 6583, [SII] 6717, [SII] 6731. The first three digits of the label give the year of observation. L00 marks those spectra that are a median of two or more spectra obtained in different runs. Galaxies are listed in order of catalog names. A representative sample of 12 spectra is shown. The full set of 376 spectra is available in electronic form at the CDS.
Current usage metrics show cumulative count of Article Views (full-text article views including HTML views, PDF and ePub downloads, according to the available data) and Abstracts Views on Vision4Press platform.
Data correspond to usage on the plateform after 2015. The current usage metrics is available 48-96 hours after online publication and is updated daily on week days.
Initial download of the metrics may take a while.