Fig. 3
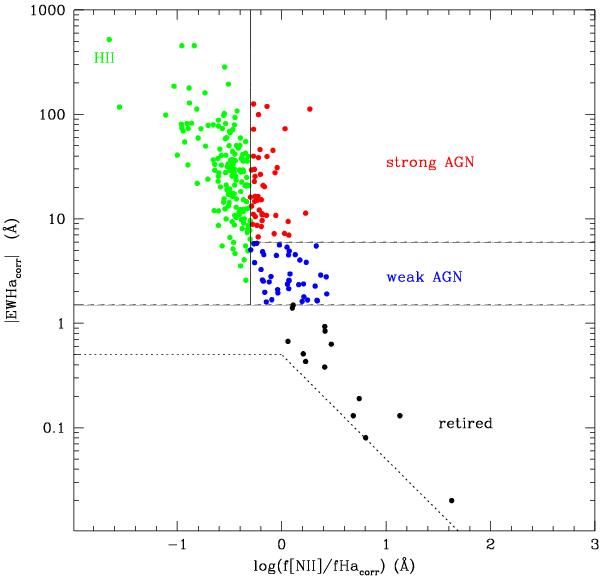
WHAN diagnostic diagram for nuclei whose Hαcorr line is detected in emission. The equivalent width of Hα is corrected by 1.3 Å for underlying absorption. Passive nuclei never appear in the figure, because they have either Hαcorr in absorption or undetected [NII]. The 4 SEY1 objects identified by their broad-line systems are not plotted.
Current usage metrics show cumulative count of Article Views (full-text article views including HTML views, PDF and ePub downloads, according to the available data) and Abstracts Views on Vision4Press platform.
Data correspond to usage on the plateform after 2015. The current usage metrics is available 48-96 hours after online publication and is updated daily on week days.
Initial download of the metrics may take a while.