Free Access
Fig. 2
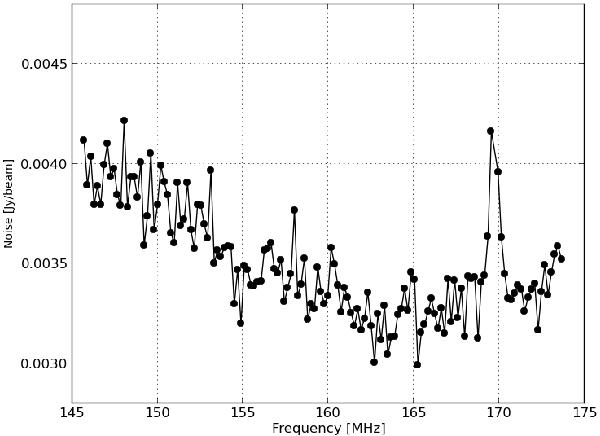
Behaviour of the noise as a function of frequency in maps obtained with CASA imager. A prominent peaked feature in the noise level is seen around 169 MHz. A thermal noise level of about 1 mJy beam-1 is expected for each subband over the range 146–174 MHz for this observation.
Current usage metrics show cumulative count of Article Views (full-text article views including HTML views, PDF and ePub downloads, according to the available data) and Abstracts Views on Vision4Press platform.
Data correspond to usage on the plateform after 2015. The current usage metrics is available 48-96 hours after online publication and is updated daily on week days.
Initial download of the metrics may take a while.