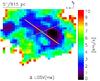
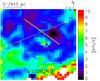
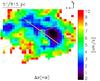
Fig. 6
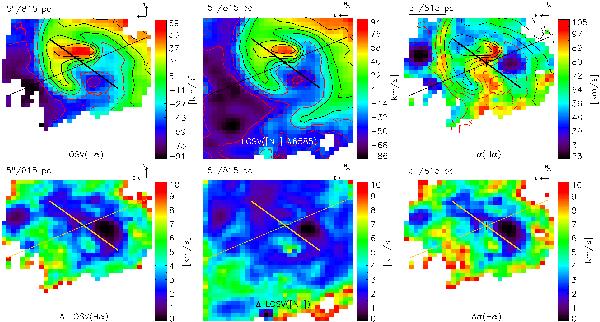
Upper row (left): Hα line of sight velocity maps with overplotted major axis of the primary (thin line) and the secondary bar (thick line). The contours mark the velocities − 60, − 40, − 20, 0, 20, and 40 km s-1. Contours of negative velocities are red. (Center): [N ii] λ6585 line of sight velocity map. It has been derived before the subtraction of the stellar continuum and clipping of spaxels according to the criteria outlined in the text. Both velocity maps show the same morphology. (Right): Hα velocity dispersion map corrected for instrumental resoulution. The isovelocity contours of Hα line emission are overplotted. Lower row: the error maps corresponding to the maps in the upper row.
Current usage metrics show cumulative count of Article Views (full-text article views including HTML views, PDF and ePub downloads, according to the available data) and Abstracts Views on Vision4Press platform.
Data correspond to usage on the plateform after 2015. The current usage metrics is available 48-96 hours after online publication and is updated daily on week days.
Initial download of the metrics may take a while.