Fig. 4
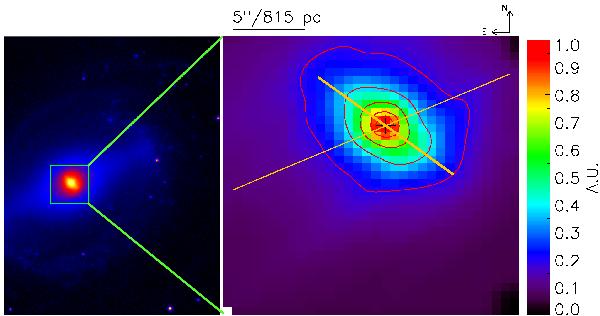
Left: SDSS r-band image of NGC 5850. Right: continuum image of NGC 5850 from 6000 to 6100 Å zoomed in on the central 27″ × 27″. The flux density is given in arbitrary units (AU). The major axis of the primary (thin line) and the secondary bar (thick line) are overplotted. The contours are given at 20, 40, 60, 80, 90, and 95 percentage of maximum flux density. The continuum peak is marked with a black cross.
Current usage metrics show cumulative count of Article Views (full-text article views including HTML views, PDF and ePub downloads, according to the available data) and Abstracts Views on Vision4Press platform.
Data correspond to usage on the plateform after 2015. The current usage metrics is available 48-96 hours after online publication and is updated daily on week days.
Initial download of the metrics may take a while.