Fig. 15
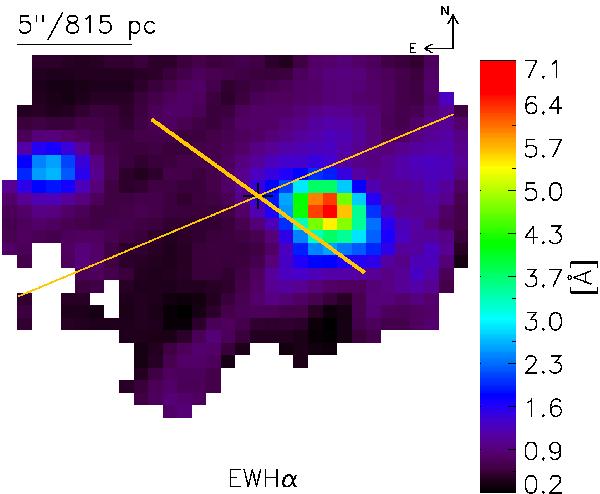
Map of the equivalent width of the Hα emission line with the major axis of the primary (thin line) and the secondary bar (thick line) overplotted. The EWHα was calculated by using the emission after the subtraction of the stellar continuum. The continuum value was measured in the spectrum before the stellar population was subtracted.
Current usage metrics show cumulative count of Article Views (full-text article views including HTML views, PDF and ePub downloads, according to the available data) and Abstracts Views on Vision4Press platform.
Data correspond to usage on the plateform after 2015. The current usage metrics is available 48-96 hours after online publication and is updated daily on week days.
Initial download of the metrics may take a while.