Fig. 12
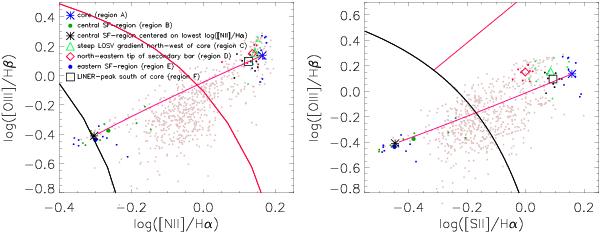
Diagnostic diagrams: the gray dots mark the positions in the diagnostic diagrams of spaxel for which we have all necessary line measurements. The big colored symbols mark areas in the FOV, consisting of stacked spectra of 3 by 3 spaxels. The small colored dots are the corresponding single spectra of which the average spectrum of a region was calculated. Medium blue asterisk: core region (A); dark green filled circle: central H ii-region centered on spaxel with brightest Hα emission (B); black asterisk: central H ii-region centered on spaxel with lowest log ([N ii]/Hα) (B); light green triangle: steep velocity gradient area northwest of core (C); red square: northeastern LINER-region close to tip of secondary bar (D); dark blue filled circle: eastern H ii-region (E); and black square: LINER peak south of core (F). The solid magenta line is the SF-AGN mixture line, as explained in the text. Left: log ([O iii] λ5008/Hβ) vs. log ([N ii]λ6585/Hα) with the extreme starburst line of Kewley et al. (2001) overplotted in red and the pure star-formation line of Kauffmann et al. (2003) in black. Right: log ([O iii] λ5008/Hβ) vs. log ([N ii] λ6585/[S ii] λλ6718 + 6732) with the LINER-Seyfert demarcation line of Kewley et al. (2006) in red and the extreme starburst line in black.
Current usage metrics show cumulative count of Article Views (full-text article views including HTML views, PDF and ePub downloads, according to the available data) and Abstracts Views on Vision4Press platform.
Data correspond to usage on the plateform after 2015. The current usage metrics is available 48-96 hours after online publication and is updated daily on week days.
Initial download of the metrics may take a while.