Fig. 11
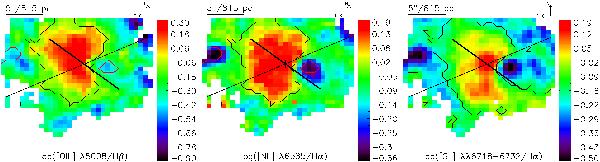
Line ratio maps overplotted with classification contours and the major axis of the primary (thin line) and the secondary bar (thick line). Left and center: areas surrounded by the black contour line correspond to AGN-like ionization. Areas enclosed by the red contour line contain regions classified as star forming. Other regions are dominated by composite-type line ratios. The classification was made according to the diagnostic diagram, the extreme starburst demarcation line of Kewley et al. (2001), and the pure star-formation demarcation line of Kauffmann et al. (2003). Right: areas encircled by the black contour line are classified as LINER-like within the log ([S ii] mathrmHα) diagnostic diagram using the LINER-Seyfert demarcation line of Kewley et al. (2006) and the extreme starburst line.
Current usage metrics show cumulative count of Article Views (full-text article views including HTML views, PDF and ePub downloads, according to the available data) and Abstracts Views on Vision4Press platform.
Data correspond to usage on the plateform after 2015. The current usage metrics is available 48-96 hours after online publication and is updated daily on week days.
Initial download of the metrics may take a while.