Free Access
Fig. 1
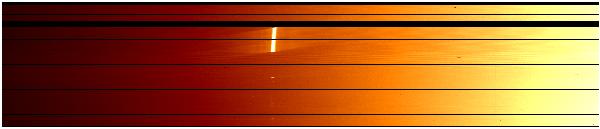
Part of a flat image as extracted by the VIMOS pipeline. Each horizontal line corresponds to a fiber and therefore to a spatial pixel. The wavelength axis extends from left (small λ) to right (high λ). The reflection at ~5100 Å is clearly visible.
Current usage metrics show cumulative count of Article Views (full-text article views including HTML views, PDF and ePub downloads, according to the available data) and Abstracts Views on Vision4Press platform.
Data correspond to usage on the plateform after 2015. The current usage metrics is available 48-96 hours after online publication and is updated daily on week days.
Initial download of the metrics may take a while.