Fig. 9
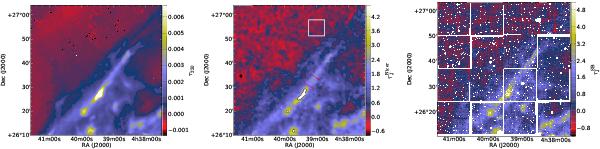
Maps of optical depth τ: Herschel
τ250 (resolution 40), NICER
 (resolution 60), and optical depth in J band,
 , based
on J, H, and K surface brightness
maps (resolution ~2.2). In the NICER map (middle frame) the
densest areas where
, based
on J, H, and K surface brightness
maps (resolution ~2.2). In the NICER map (middle frame) the
densest areas where  are marked with a blue
contour. The white rectangle marks the reference area used for background
subtraction in the analysis. The profile cross-sections shown in Fig. 12 are taken as a median from the area between the
two red lines.
are marked with a blue
contour. The white rectangle marks the reference area used for background
subtraction in the analysis. The profile cross-sections shown in Fig. 12 are taken as a median from the area between the
two red lines.
Current usage metrics show cumulative count of Article Views (full-text article views including HTML views, PDF and ePub downloads, according to the available data) and Abstracts Views on Vision4Press platform.
Data correspond to usage on the plateform after 2015. The current usage metrics is available 48-96 hours after online publication and is updated daily on week days.
Initial download of the metrics may take a while.