Fig. 5
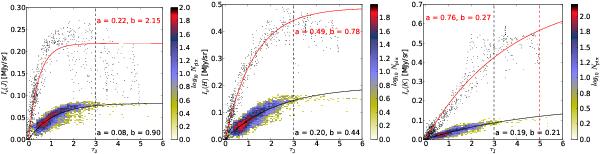
Observed NIR surface brightness Iν as
the function of optical depth derived with NICER method
 in
J, H, and K bands. WFCAM data
for TMC-1N are shown with a 2D histogram, the colour scale corresponding to the
density of points. The black line shows the fitted Eq. (2) (using
in
J, H, and K bands. WFCAM data
for TMC-1N are shown with a 2D histogram, the colour scale corresponding to the
density of points. The black line shows the fitted Eq. (2) (using
 instead of column density N). For comparison, Corona Australis data
from Juvela et al. (2008) are shown with
black dots and the fitted function with a red line. The black dashed vertical line
shows the upper limit used in the fitting of TMC-1N data in all frames and of Corona
Australis data in left and middle frames. In the right frame
(K band), the red dashed vertical line shows the upper limit used
in the fitting of Corona Australis data, as in this case higher upper limit was
needed to make a better fit. The obtained parameter values are marked in the figures
with black for TMC-1N and red for Corona Australis.
instead of column density N). For comparison, Corona Australis data
from Juvela et al. (2008) are shown with
black dots and the fitted function with a red line. The black dashed vertical line
shows the upper limit used in the fitting of TMC-1N data in all frames and of Corona
Australis data in left and middle frames. In the right frame
(K band), the red dashed vertical line shows the upper limit used
in the fitting of Corona Australis data, as in this case higher upper limit was
needed to make a better fit. The obtained parameter values are marked in the figures
with black for TMC-1N and red for Corona Australis.
Current usage metrics show cumulative count of Article Views (full-text article views including HTML views, PDF and ePub downloads, according to the available data) and Abstracts Views on Vision4Press platform.
Data correspond to usage on the plateform after 2015. The current usage metrics is available 48-96 hours after online publication and is updated daily on week days.
Initial download of the metrics may take a while.