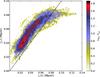
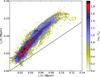
Fig. 4

Surface brightness in J band, IJ, as a function of the K band, IK, (upper frame) and IH as a function of IK (lower frame) for the main filament area shown in Fig. 2. The y = x function is denoted by a black line. The colour scale of the 2D histogram indicates the logarithmic density of the points, both here and in other figures. The data are convolved to 40 resolution.
Current usage metrics show cumulative count of Article Views (full-text article views including HTML views, PDF and ePub downloads, according to the available data) and Abstracts Views on Vision4Press platform.
Data correspond to usage on the plateform after 2015. The current usage metrics is available 48-96 hours after online publication and is updated daily on week days.
Initial download of the metrics may take a while.