Free Access
Fig. 2
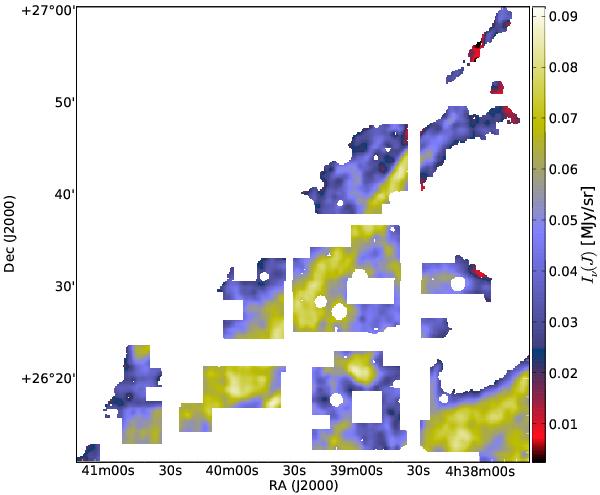
J band intensity map with low column density areas (below 1.0 × 1021 cm) and bad pixels masked. Only the shown unmasked data are used in the scatter plot analysis.
Current usage metrics show cumulative count of Article Views (full-text article views including HTML views, PDF and ePub downloads, according to the available data) and Abstracts Views on Vision4Press platform.
Data correspond to usage on the plateform after 2015. The current usage metrics is available 48-96 hours after online publication and is updated daily on week days.
Initial download of the metrics may take a while.