Fig. 14
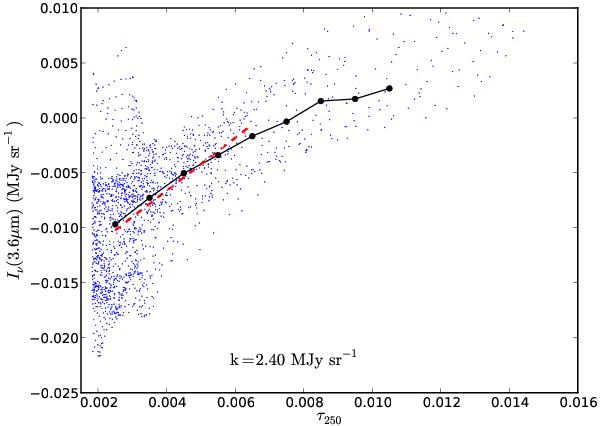
Spitzer 3.6 μm surface brightness as the function of τ250 derived from Herschel data. The black circles show the median surface brightness in τ250 = 0.002 wide bands. The dashed red line is a robust least squares fit to the range τ250 = 0.0025–0.0065, with the slope, k, given at the bottom of the frame. The zero point of the Iν (3.6 μm) axis is arbitrary.
Current usage metrics show cumulative count of Article Views (full-text article views including HTML views, PDF and ePub downloads, according to the available data) and Abstracts Views on Vision4Press platform.
Data correspond to usage on the plateform after 2015. The current usage metrics is available 48-96 hours after online publication and is updated daily on week days.
Initial download of the metrics may take a while.