Fig. 12
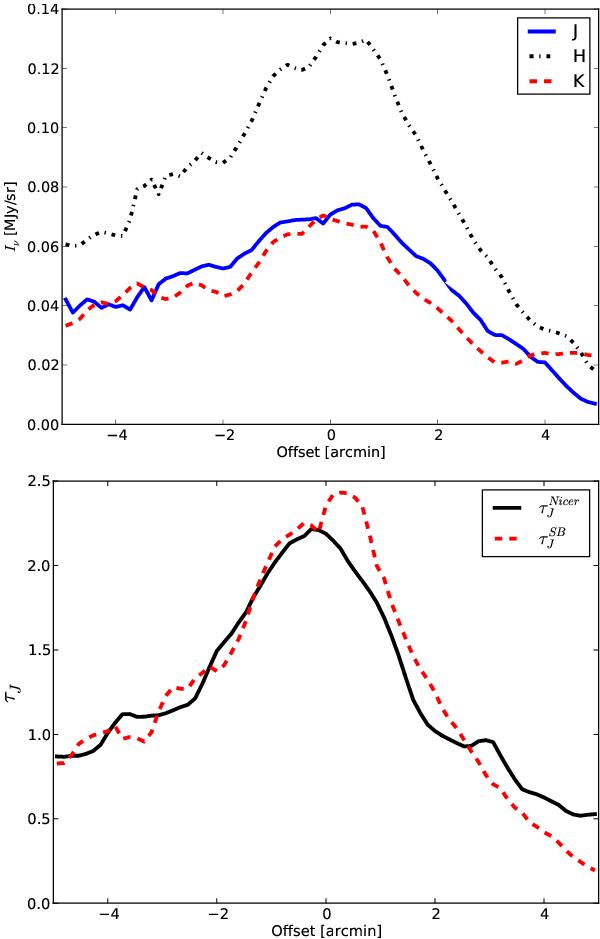
Median profile cross-sections of the filament, taken from the area between the two
red lines shown in Fig. 9 (middle frame).
(Upper frame) WFCAM maps in J,
H, and K bands. (Lower frame)
 is
derived from NICER extinction map and
is
derived from NICER extinction map and  from
WFCAM surface brightness maps, respectively.
from
WFCAM surface brightness maps, respectively.
Current usage metrics show cumulative count of Article Views (full-text article views including HTML views, PDF and ePub downloads, according to the available data) and Abstracts Views on Vision4Press platform.
Data correspond to usage on the plateform after 2015. The current usage metrics is available 48-96 hours after online publication and is updated daily on week days.
Initial download of the metrics may take a while.