Fig. 11
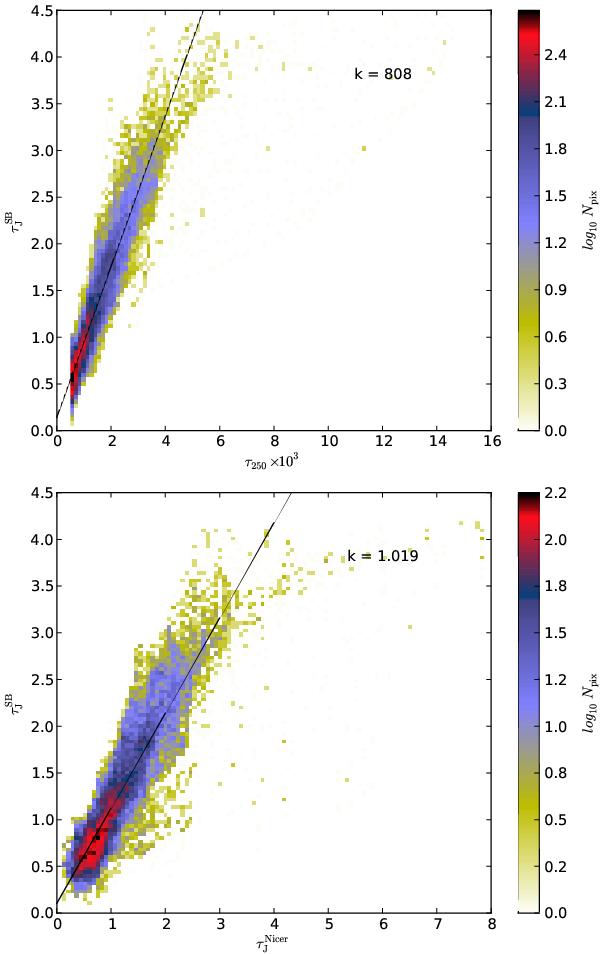
Correlations between τSB and
τ250 with resolution 40 (upper frame)
and between τSB and
 with resolution 60 (lower frame). The data are fitted with a
straight line, marked with black line. The fitted values for the slope,
k, are marked to the figures.
with resolution 60 (lower frame). The data are fitted with a
straight line, marked with black line. The fitted values for the slope,
k, are marked to the figures.
Current usage metrics show cumulative count of Article Views (full-text article views including HTML views, PDF and ePub downloads, according to the available data) and Abstracts Views on Vision4Press platform.
Data correspond to usage on the plateform after 2015. The current usage metrics is available 48-96 hours after online publication and is updated daily on week days.
Initial download of the metrics may take a while.