Fig. 9
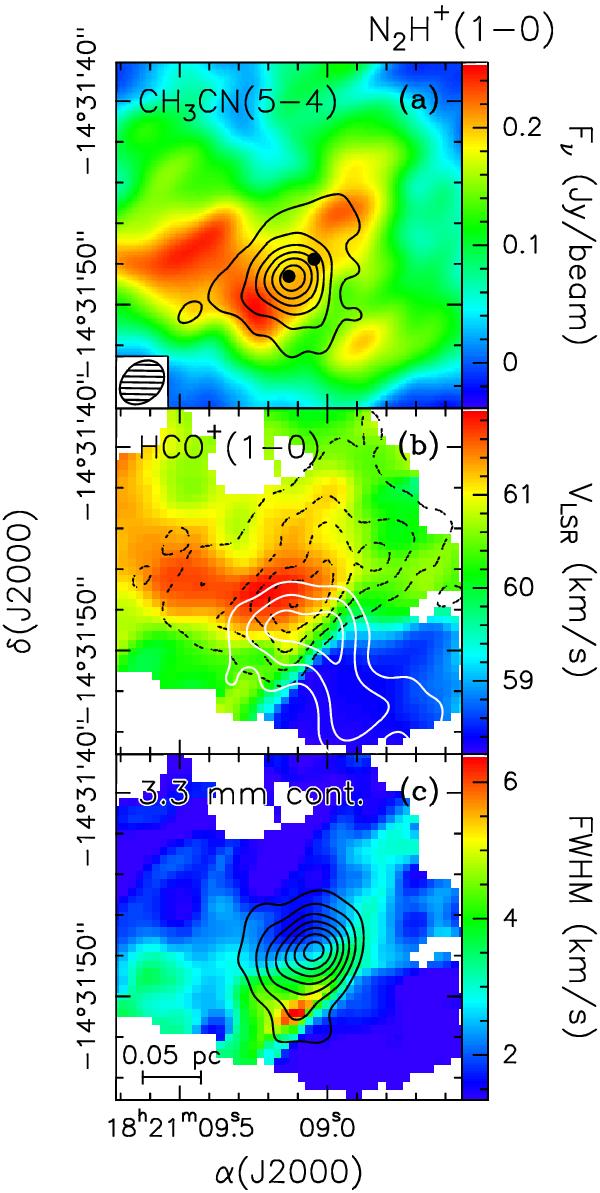
Obtained from the data of F2008: a) Map of the CH3CN(5–4) line emission (contours) tracing the HMC, overlaid on a map of the N2H+(1–0) emission (from F2008) averaged over the main line (color scale). The black dots indicate the positions of the centimeter sources “a” (alias mm-core) and “b” (alias HMC), detected by Zapata et al. (2006). b) Maps of the blue- (solid white contours) and red-shifted (dashed black) emission of the HCO+(1–0) line overlaid on a map of the N2H+(1–0) line velocity. The HCO+(1–0) maps are derived using the most extreme velocity channels (1.68 km s-1 wide) at which emission was detected by F2008, centered at 55.8 km s-1 and 62.5 km s-1 for the blue- and red-shifted line, respectively. c) Map of the 3.3 mm continuum emission (contours) tracing the mm-core, overlaid on a map of the N2H+(1–0) line FWHM.
Current usage metrics show cumulative count of Article Views (full-text article views including HTML views, PDF and ePub downloads, according to the available data) and Abstracts Views on Vision4Press platform.
Data correspond to usage on the plateform after 2015. The current usage metrics is available 48-96 hours after online publication and is updated daily on week days.
Initial download of the metrics may take a while.