Fig. 8
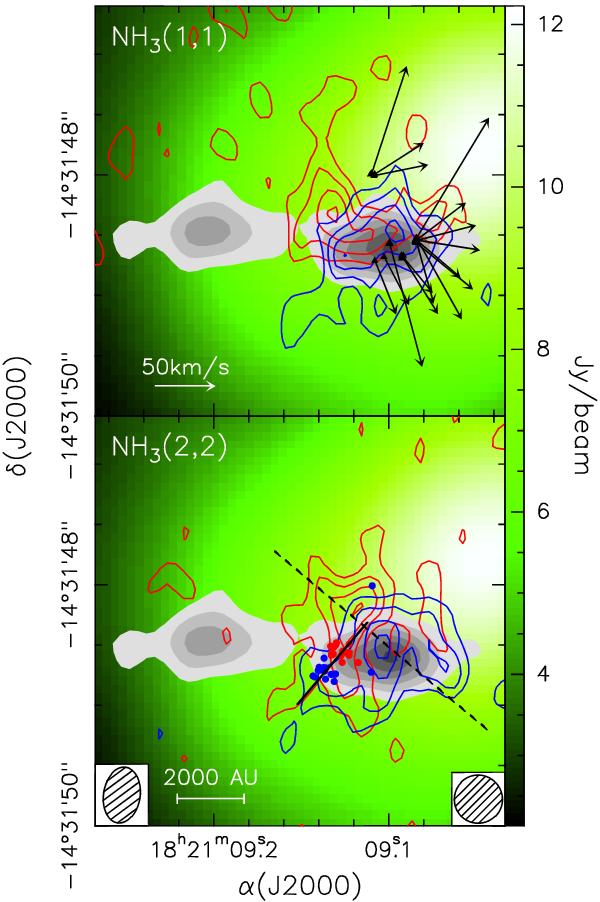
Maps of the two velocity components (see Fig. 7) identified in the NH3(1, 1) (top) and (2, 2) (bottom) lines. Blue and red contours are the maps obtained by averaging the main line emission, respectively, from 55.8 to 60.6 km s-1and from 60.6 to 63.0 km s-1. The gray scale is the same map of the 6 cm continuum emission as in Fig. 2a, while the backgroud image (green tones) is the map of the 3.3 mm continuum emission obtained by F2008. The red and blue dots give the position of the red- and blue-shifted, respectively, methanol masers from S2010. The black triangles and arrows are the water maser spots and corresponding proper motions from S2010. The amplitude scale for the proper motions is given on the bottom left of the upper panel. The continuous and dashed line in the lower panel indicate the axes of projection to produce the position-velocity plots of Figs. 10 and 11, respectively. The ellipses in the bottom left and right of the lower panel indicate, respectively, the HPBW of the 6 cm continuum and ammonia line maps.
Current usage metrics show cumulative count of Article Views (full-text article views including HTML views, PDF and ePub downloads, according to the available data) and Abstracts Views on Vision4Press platform.
Data correspond to usage on the plateform after 2015. The current usage metrics is available 48-96 hours after online publication and is updated daily on week days.
Initial download of the metrics may take a while.