Fig. 7
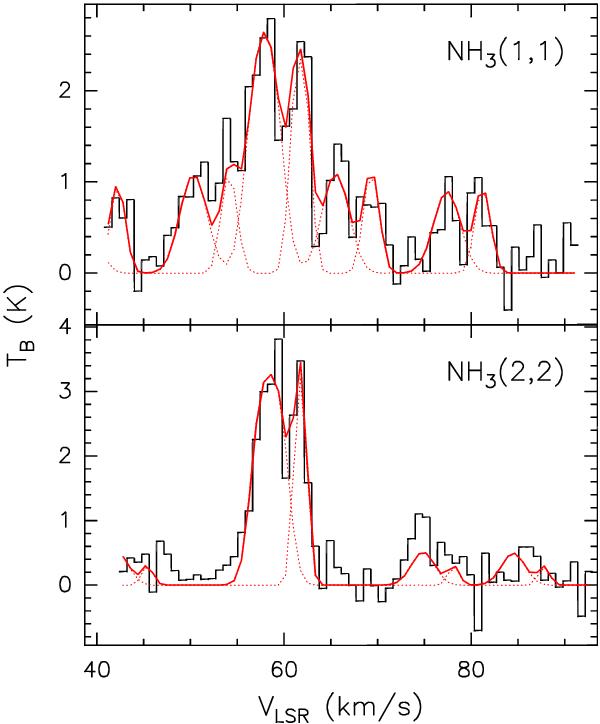
Spectra of the NH3(1,1) (top) and (2,2) (bottom) inversion transitions obtained by averaging the emission over the HMC. The red solid curves are multiple Gaussian fits taking into account the hyperfine structure of the lines and two distinct velocity components (at about 58.2 km s-1 and 61.8 km s-1). The red dotted curves indicate the contribution of each velocity component to the total fit.
Current usage metrics show cumulative count of Article Views (full-text article views including HTML views, PDF and ePub downloads, according to the available data) and Abstracts Views on Vision4Press platform.
Data correspond to usage on the plateform after 2015. The current usage metrics is available 48-96 hours after online publication and is updated daily on week days.
Initial download of the metrics may take a while.