Fig. 6
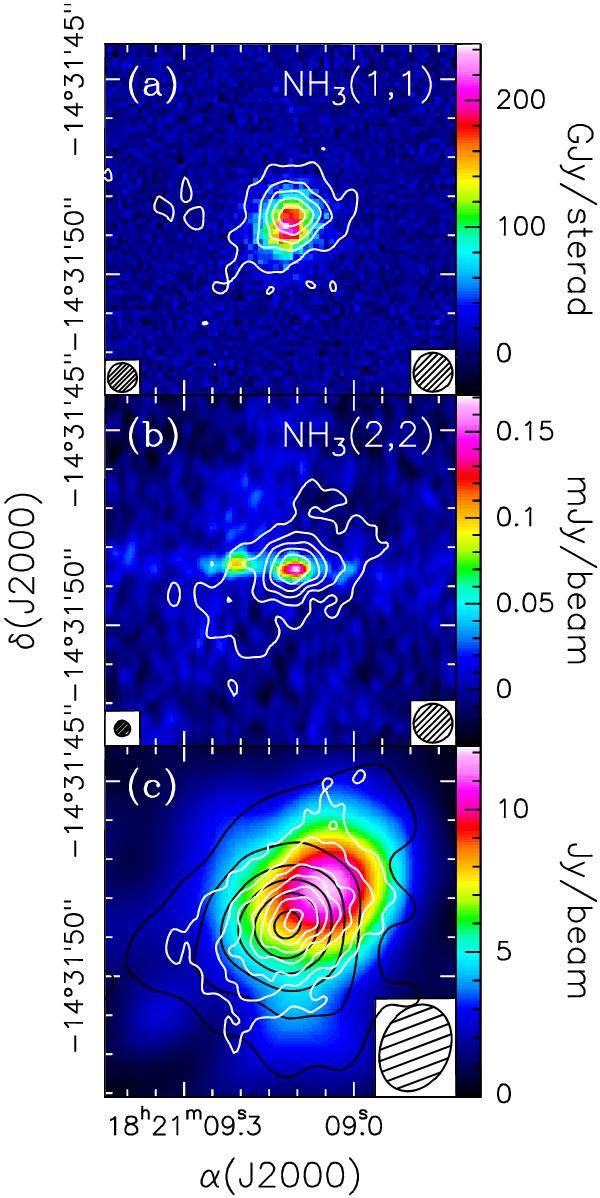
a) Map of the NH3(1,1) emission averaged over the main line (white contours) overlaid on an image of the 24.5 μm continuum emission obtained with Subaru. The circles in the bottom left and right indicate, respectively, the angular resolution of the IR and radio data. b) Same as panel a), for the NH3(2,2) line (contours) and the 6 cm radio continuum map (background image). c) Overlay between the NH3(2,2) (white contours), CH3CN(5–4) (black contours), and 3.3 mm continuum (image) maps. The ammonia map has been smoothed to the same angular resolution (ellipse in the bottom right) as the methyl cyanide data (from F2008).
Current usage metrics show cumulative count of Article Views (full-text article views including HTML views, PDF and ePub downloads, according to the available data) and Abstracts Views on Vision4Press platform.
Data correspond to usage on the plateform after 2015. The current usage metrics is available 48-96 hours after online publication and is updated daily on week days.
Initial download of the metrics may take a while.