Fig. 5
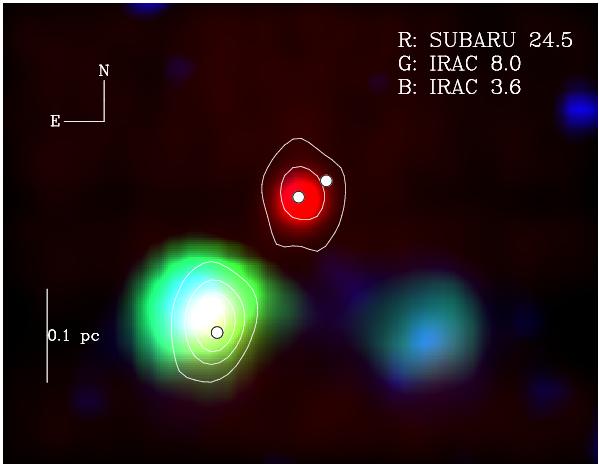
Composite color image of the same field shown in Fig. 4, where blue is associated with the GLIMPSE/Spitzer 3.6 μm image, green with the GLIMPSE/Spitzer 8.0 μm image, and red with our 24.5 μm Subaru image. The reddest and hence most extincted source is the one to the north, coinciding with the HMC. The VLA 3.6 cm continuum (from S2010) is shown with white contours. The white dots have the same meaning as in Fig. 4.
Current usage metrics show cumulative count of Article Views (full-text article views including HTML views, PDF and ePub downloads, according to the available data) and Abstracts Views on Vision4Press platform.
Data correspond to usage on the plateform after 2015. The current usage metrics is available 48-96 hours after online publication and is updated daily on week days.
Initial download of the metrics may take a while.