Fig. 4
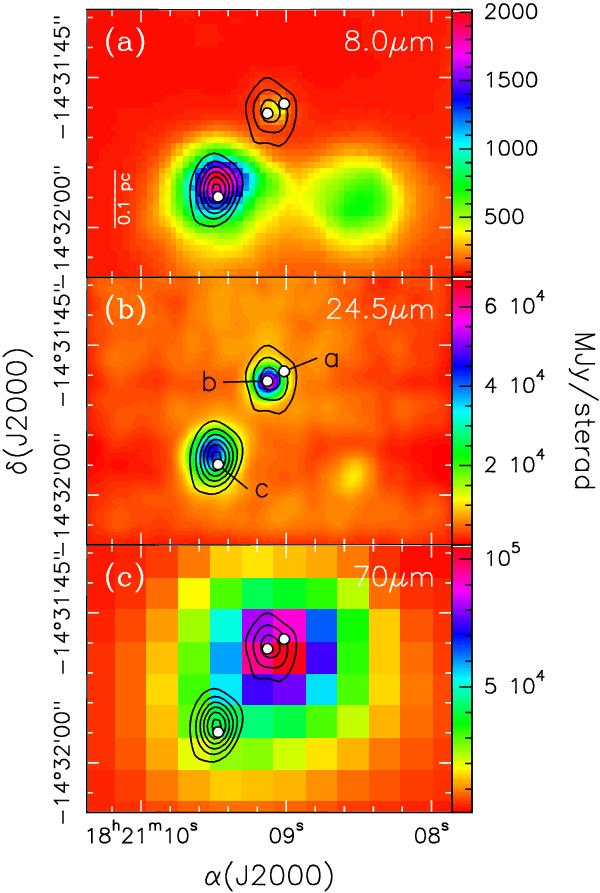
a) Map of the continuum emission at 3.6 cm (black contours; from S2010) overlaid on an 8.0 μm image (resolution 2′′) of the G16.59−0.05 region from the GLIMPSE/Spitzer survey (Benjamin et al. 2003). b) Same as panel a), for our Subaru 24.5 μm image smoothed to the same angular resolution as the 8.0 μm image (2′′). c) Same as panel a), for the Hi-GAL/Herschel (Molinari et al. 2010b) 70 μm image (resolution ~10′′). The white dots indicate the positions of the centimeter sources “a” (alias mm-core), “b” (alias HMC) and “c” detected by Zapata et al. (2006).
Current usage metrics show cumulative count of Article Views (full-text article views including HTML views, PDF and ePub downloads, according to the available data) and Abstracts Views on Vision4Press platform.
Data correspond to usage on the plateform after 2015. The current usage metrics is available 48-96 hours after online publication and is updated daily on week days.
Initial download of the metrics may take a while.