Fig. 2
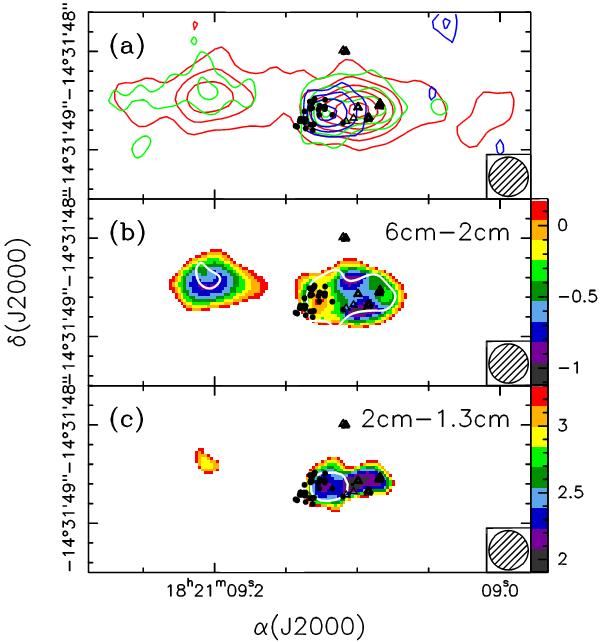
a) Overlay of the VLA maps of the radio continuum emission at 6, 2, and 1.3 cm obtained using the common uv range and the same clean beam (shown in the bottom right) at all wavelengths. Contours and symbols have the same meaning as in Fig. 1. The contour levels range from 0.0264 to 0.1584 in steps of 0.0264 mJy beam-1 at 6 cm, from 0.03 to 0.12 in steps of 0.03 mJy beam-1 at 2 cm, and from 0.174 to 0.348 in steps of 0.058 mJy beam-1 at 1.3 cm. b) Map of the spectral index between 6 and 2 cm, computed where the 6 cm emission is >5σ. The white contour encompasses the region where also the 2 cm emission is >5σ. The values of the spectral index lying outside the white contour are upper limits. c) Same as panel b), for the spectral index between 2 and 1.3 cm.
Current usage metrics show cumulative count of Article Views (full-text article views including HTML views, PDF and ePub downloads, according to the available data) and Abstracts Views on Vision4Press platform.
Data correspond to usage on the plateform after 2015. The current usage metrics is available 48-96 hours after online publication and is updated daily on week days.
Initial download of the metrics may take a while.