Free Access
Fig. 12
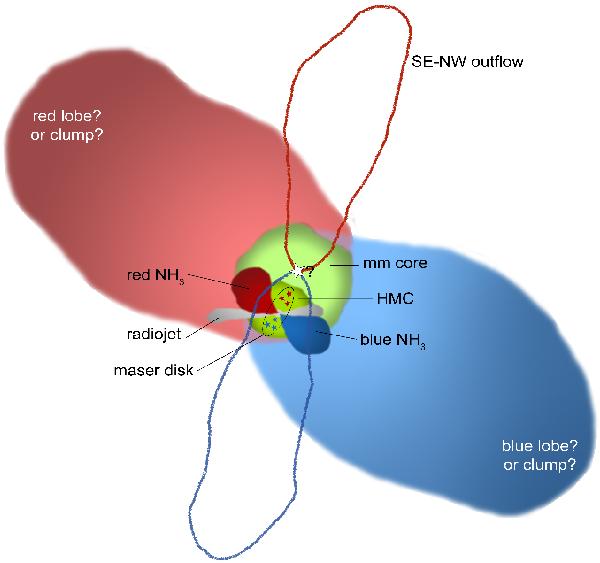
Sketch of the scenarios proposed to explain all the features observed in the G16.59−0.05 region. Note that the relative sizes of the different structures (disk, jet, outflow, etc.) have been arbitrarily chosen to make the figure more readable.
Current usage metrics show cumulative count of Article Views (full-text article views including HTML views, PDF and ePub downloads, according to the available data) and Abstracts Views on Vision4Press platform.
Data correspond to usage on the plateform after 2015. The current usage metrics is available 48-96 hours after online publication and is updated daily on week days.
Initial download of the metrics may take a while.