Fig. 10
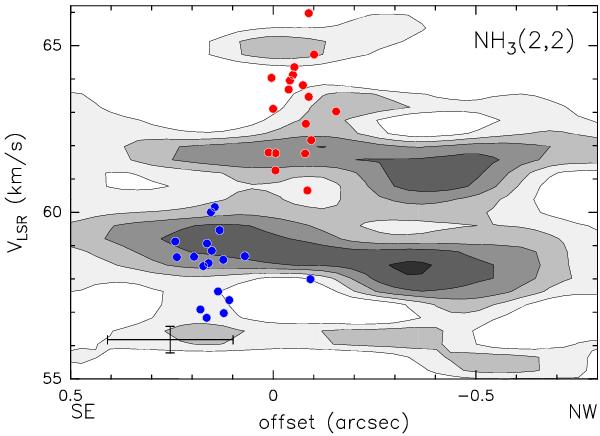
Position–velocity plot of the NH3(2,2) line emission along a direction crossing the centers of the red- and blue-shifted CH3OH maser clusters (PA = 140°). Contour levels range from 2 to 6 mJy/beam in steps of 1 mJy/beam. The red and blue circles represent the methanol maser spots. The cross in the bottom left indicates the angular and spectral resolutions.
Current usage metrics show cumulative count of Article Views (full-text article views including HTML views, PDF and ePub downloads, according to the available data) and Abstracts Views on Vision4Press platform.
Data correspond to usage on the plateform after 2015. The current usage metrics is available 48-96 hours after online publication and is updated daily on week days.
Initial download of the metrics may take a while.