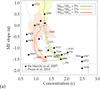
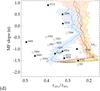
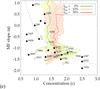
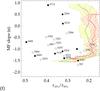
Fig. 6
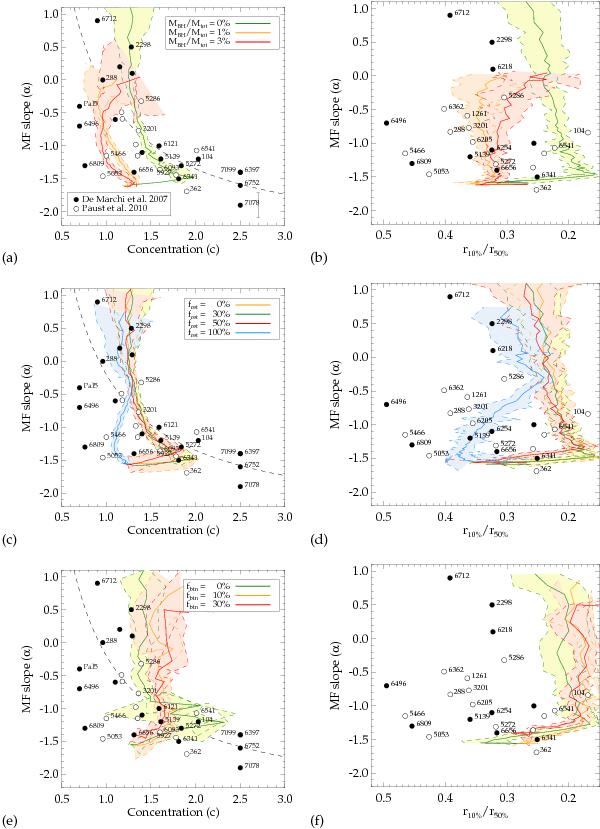
α – c plane (left panels) and α − r10%/r50% plane (right panels) of observed GCs compared with N-body simulations. Shaded areas mark the 3σ limit of the simulations. Clusters falling within these limits and not overlapping with other models are considered to be well-represented by these models. The error bar in panel a) is representative for the uncertainties in α for the observed clusters. The labeled clusters are discussed in Sect. 5.
Current usage metrics show cumulative count of Article Views (full-text article views including HTML views, PDF and ePub downloads, according to the available data) and Abstracts Views on Vision4Press platform.
Data correspond to usage on the plateform after 2015. The current usage metrics is available 48-96 hours after online publication and is updated daily on week days.
Initial download of the metrics may take a while.