Free Access
Fig. 9
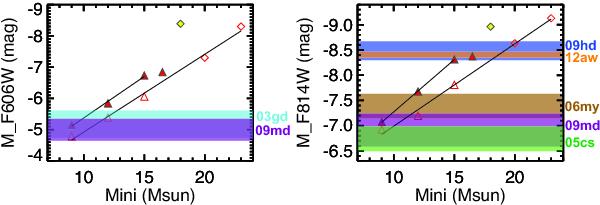
Absolute magnitudes in the HST/WFPC F606W and F814W filters as a function of initial mass for RSGs at the pre-SN stage. Symbols are as in Fig. 6. Least-squares linear fits for both models (see text) are also shown. The colored bands represent the absolute magnitude ± 1 sigma of observed RSGs that underwent core-collapse SN.
Current usage metrics show cumulative count of Article Views (full-text article views including HTML views, PDF and ePub downloads, according to the available data) and Abstracts Views on Vision4Press platform.
Data correspond to usage on the plateform after 2015. The current usage metrics is available 48-96 hours after online publication and is updated daily on week days.
Initial download of the metrics may take a while.