Fig. 10
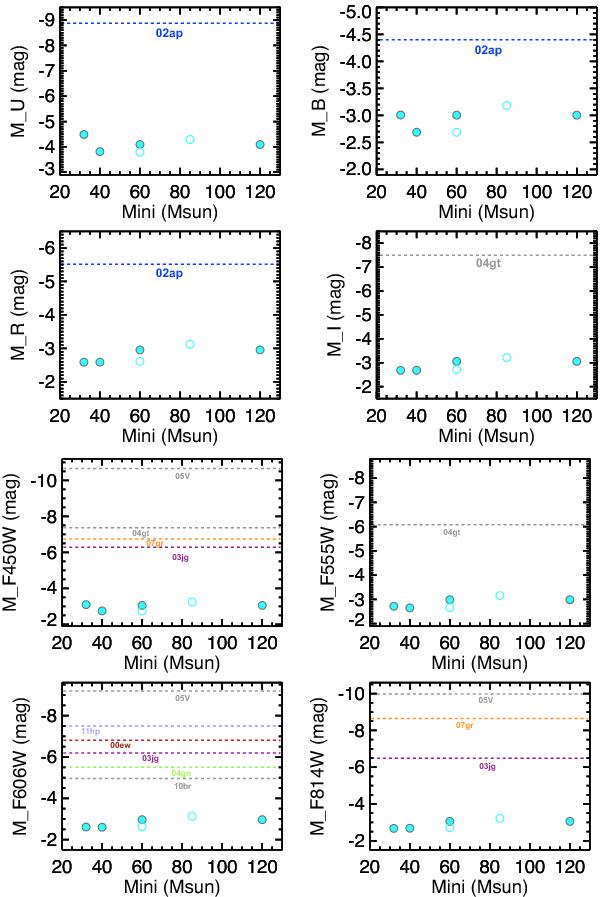
Absolute magnitude of our models that are SN Ic progenitors (open and filled cyan circles) compared to observed upper magnitude limit for different SNe Ic (colored horizontal dashed lines followed by shortened SN label) and SN Ibc (gray horizontal dashed lines). Open (filled) symbols correspond to non-rotating (rotating) models. From top to bottom, we show the comparison between model and observations in the UBRI and HST/WFPC2 F450W, F555W, F606W, and F814W filters. Note that all models lie below the detectability limit of all SN Ic and Ibc.
Current usage metrics show cumulative count of Article Views (full-text article views including HTML views, PDF and ePub downloads, according to the available data) and Abstracts Views on Vision4Press platform.
Data correspond to usage on the plateform after 2015. The current usage metrics is available 48-96 hours after online publication and is updated daily on week days.
Initial download of the metrics may take a while.