Fig. 33
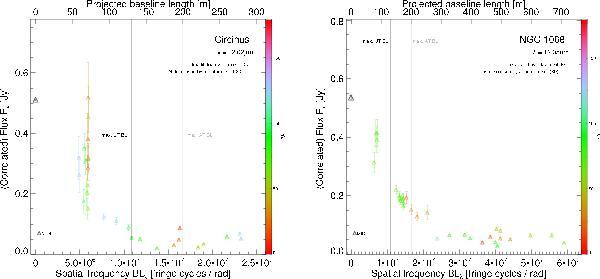
Expected radial plot for Large Program sources, if the expectation is based on the two brightest targets, Circinus galaxy and NGC 1068. For this figure, these two targets have been “placed” at respective distances  and
and  times as far away as they actually are so that their flux matches the median flux of the weak sources. At these distances, baselines much longer than those offered at the VLTI (black/gray: maximum baseline using UTs/ATs) would be needed to resolve the elongated disk component that has been found with MIDI in these two bright and nearby sources.
Current usage metrics show cumulative count of Article Views (full-text article views including HTML views, PDF and ePub downloads, according to the available data) and Abstracts Views on Vision4Press platform.
Data correspond to usage on the plateform after 2015. The current usage metrics is available 48-96 hours after online publication and is updated daily on week days.
Initial download of the metrics may take a while.