Free Access
Fig. 9
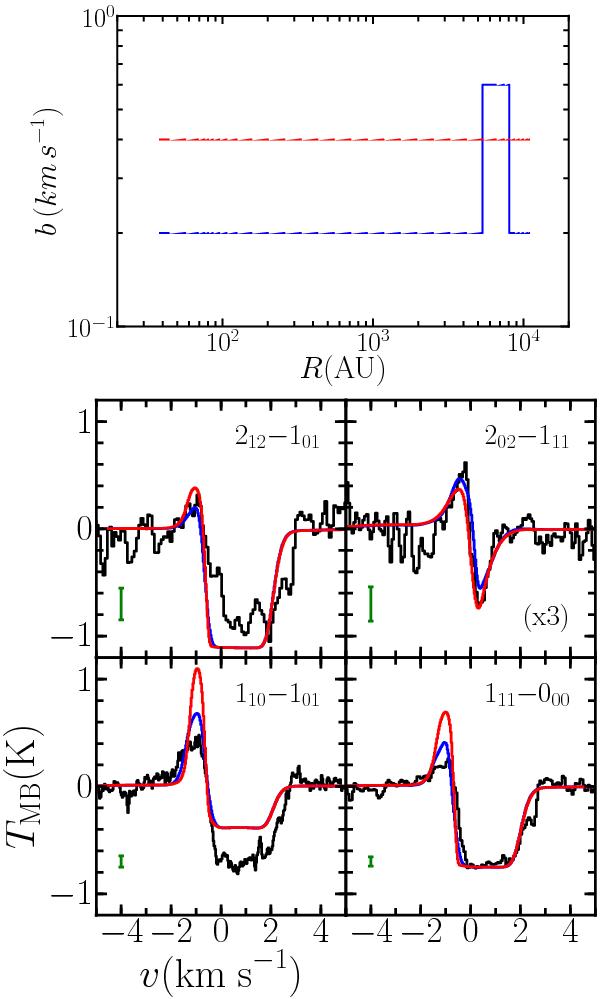
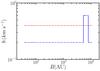
Top: best-fit model for IRAS4A with a constant b profile (red) and one with a jump between 5000 and 8000 AU (blue) but with all other variables held at the best-fit values. Bottom: comparison of the resulting line profiles with the data. The green error bar and scaling factors are the same as in Fig. 6.
This figure is made of several images, please see below:
Current usage metrics show cumulative count of Article Views (full-text article views including HTML views, PDF and ePub downloads, according to the available data) and Abstracts Views on Vision4Press platform.
Data correspond to usage on the plateform after 2015. The current usage metrics is available 48-96 hours after online publication and is updated daily on week days.
Initial download of the metrics may take a while.