Fig. 8
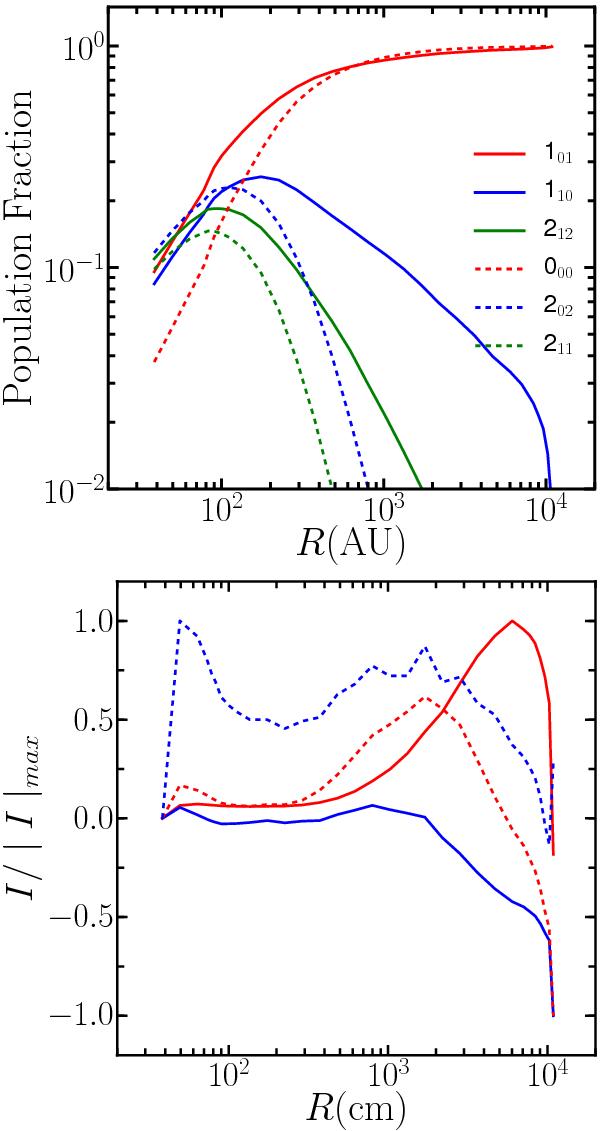
Top: population fraction as a function of radius for the ortho (solid) and para (dashed) levels contributing to the four detected lines for the best-fit model for IRAS4A. Bottom: cumulative contribution (I(r)) for the H2O 110 −101 (solid red), 212 −101 (solid blue), 111 −000 (dashed red) and 202 −111 (dashed blue) lines for the best-fit model relative to the maximum absolute integrated intensity in each line (|I| max).
Current usage metrics show cumulative count of Article Views (full-text article views including HTML views, PDF and ePub downloads, according to the available data) and Abstracts Views on Vision4Press platform.
Data correspond to usage on the plateform after 2015. The current usage metrics is available 48-96 hours after online publication and is updated daily on week days.
Initial download of the metrics may take a while.